Picture an auditor opening your purchasing procedure. It runs six pages. Somewhere in those pages is the step where a purchase order gets approved, the record that proves it happened, and the role that signed off. The auditor has about an hour for this process before moving to the next one.
Now picture the same procedure as a single page: a box for each step, a lane for each role, a decision diamond where the path can fork, and a small document symbol wherever a form or record is produced. Same procedure, same requirements. One of these versions gets you through the hour with time to spare.
Every certification our clients pursue, whether ISO 9001, AISC, AMPP/SSPC QP, or API Q1, comes down to the same demand: show us the process, show us who owns each step, and show us the evidence. A well-built flowchart answers all three at a glance. The reasons companies keep switching from prose procedures to process maps come down to three things: responsibility, records, and audits.
1. Everyone Can See Who Owns What
The most common gap we find in a quality management system is not a missing procedure. It is a procedure that exists, reads well, and still leaves two people each assuming the other one signs the inspection report.
Written procedures hide responsibility in the grammar. “The part is inspected and released” tells you what happens and nothing about who does it. A flowchart with a lane per role cannot make that mistake. Each box sits in someone’s lane, so the reader immediately sees:
- Who initiates a task
- Who reviews or approves it
- When responsibility transfers to another role
- Where management approval is required
- Who has final authority for completion
The day-to-day payoff
People stop asking “who does what” and stop duplicating each other’s work. Handoffs happen on time because the next lane can see the work arriving. New hires and cross-trained staff can step into a role from the chart alone, without re-reading the whole procedure to find their part in it.
The audit payoff
During an audit, the same chart is your evidence that roles, authority, and accountability are defined, something every major standard requires you to demonstrate, not just claim. ISO 9001 puts it under organizational roles (clause 5.3); AISC, API Q1, and the AMPP QP programs each expect documented assignment of responsibility for quality-critical activities. For fabricators preparing for an AISC certification audit, a role-labeled flowchart is precisely the kind of evidence the auditor wants to see first.
2. The Records Are on the Map, Not Buried in the Text
Doing the work is only half of what a standard asks for. The other half is proving the work was done correctly, which means records. Inspection reports, purchase orders, calibration records, welding logs, coating inspection reports, corrective action forms, training records: each one is objective evidence, and an auditor will ask to see them. If a required record is missing, the step is treated as if it never happened.
A document symbol is hard to skim past
In a written procedure, the sentence that says “complete Form QF-12” is easy to miss. On a flowchart, a document symbol next to a step is not. A good process map shows, at each point where it applies:
- Required forms
- Supporting records
- Inspection reports
- Approval documents
- Quality records
- Customer deliverables
Employees learn not just what to do but what to keep, and at which point in the process it has to exist.
The chart as navigation for the paperwork
Once the chart lives in your document control system, those symbols can link straight to the current revision of each form. The procedure becomes the navigation for the paperwork instead of a description of it: open the chart, follow the steps, click through to the record. Document control gets easier as well. When a form is revised, the flowcharts tell you every process that uses it.
3. Audits Go Faster, and They Go Better
An auditor’s job is to confirm that your documented process matches what actually happens on the floor. With a text procedure, a good share of the audit hour goes to the auditor reconstructing the workflow in their head before they can check anything against it.
What the auditor sees in the first minute
Hand them a flowchart and that reconstruction is already done. Within a minute they can see:
- The sequence of activities
- Responsible roles for each task
- Required approvals
- Decision points and how exceptions are handled
- Inputs and outputs
- Required documentation and where it is created
- Opportunities for improvement
The conversation shifts from “help me understand this document” to “show me this step working.” That is a better audit for you, because the hour is spent on process effectiveness rather than on deciphering, and the findings that come out of it tend to be more useful.
The same benefit inside the company
Internal auditors can walk a chart step by step, pulling the record at each document symbol as they go, and know they have covered the process end to end when they reach the last box. The flowchart effectively becomes the audit checklist. Companies that work this way ahead of an AMPP QP-1 audit or an AISC certification audit tend to find and close their own gaps before a third party does.
Where to Start
You do not have to redraw every procedure at once. Pick the process an auditor will spend the most time on, usually purchasing, inspection, or corrective action, and map that one first. A practical sequence:
- Choose one process with the most handoffs or the most records. Those are where written procedures fail first.
- Assign one role per lane. If a box does not fit in any lane, you have found an ownership gap worth fixing before the auditor does.
- Mark every record with a document symbol at the step where it is created, and confirm each one is a controlled form.
- Put the finished chart at the front of the written procedure rather than replacing the text entirely. The prose still holds the detail; the chart is how people find their way through it.
Key Takeaways
- Responsibility becomes visible. A lane per role ends “who does what” confusion and satisfies the roles-and-authority requirements in ISO 9001, AISC, API Q1, and AMPP QP.
- Records sit on the process. Document symbols show which forms each step produces, so employees keep the right evidence and document control stays organized.
- Audits get shorter and more useful. Auditors, external and internal, see the whole process at once and spend the hour on effectiveness instead of reading.
Frequently Asked Questions
Do flowcharts replace written procedures?
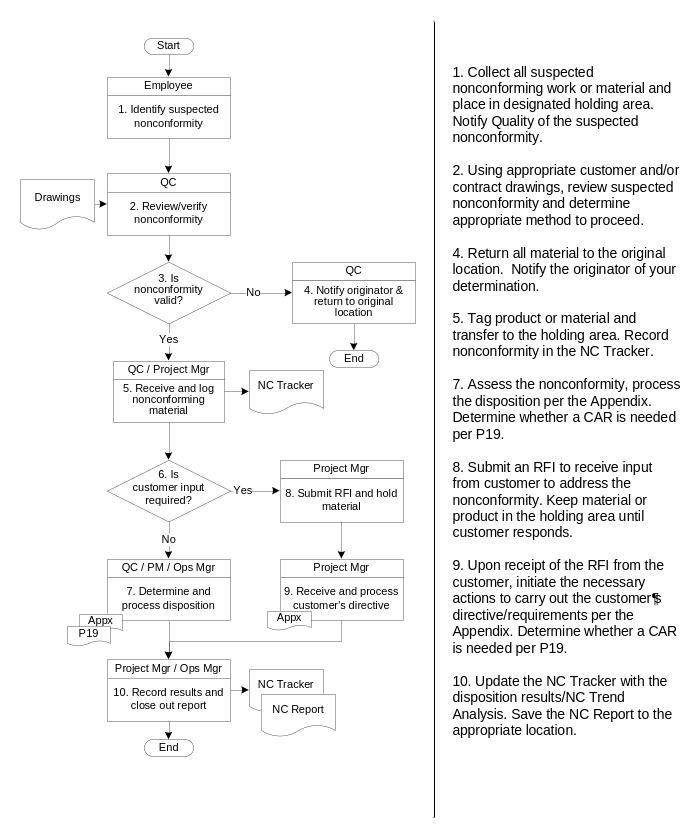
They can, but they do not have to. Many companies keep the chart at the front of the procedure and the prose behind it for detail (as in Figure 1, where numbered notes sit beside the chart). ISO 9001, API Q1, and the AISC and AMPP programs specify what must be documented, not the format, so a controlled flowchart is an acceptable form of documented information as long as it covers the required content.
Which processes should be flowcharted first?
The ones an auditor follows end to end: purchasing and supplier control, inspection and testing, control of nonconforming product, corrective action, calibration, and document and record control. These are where handoffs and records are most often misunderstood.
How detailed should a process flowchart be?
Detailed enough that a competent employee can perform the process from the chart and its notes, and no more. One page per process is a good target. A chart that spills onto a second page is usually a sign the process should be split into two procedures.
Can one set of flowcharts support more than one certification?
Yes. Because the standards ask for the same fundamentals (defined responsibility, controlled records, auditable evidence), one set of process maps can anchor an integrated management system covering, for example, ISO 9001 and API Q1, or AISC and AMPP QP. Our comparison of API Spec Q1 vs. ISO 9001 shows how much the requirements overlap.
What a Process Flowchart Looks Like in a Quality Management System
A process flowchart (also called a process map or workflow diagram) shows the steps of a procedure in the order they occur. In a quality management system (QMS), the vocabulary is small and consistent:
- Process boxes for each activity, labeled with the role that performs it
- Swimlanes, one band per role or department, so ownership is visible without reading a word
- Decision diamonds for yes/no branches such as “Is the nonconformity valid?”
- Document symbols for the forms, logs, and reports generated or referenced at each step
- Start and end terminators that mark where the process begins, ends, and hands off
The example below, taken from a nonconformance control procedure, shows how these pieces work together on one page.
Keeping the Certification, Not Just Earning It
Whether you are pursuing ISO certification, gaining or maintaining AISC compliance, implementing AMPP/SSPC requirements, or operating under API standards, the ability to communicate a process clearly is fundamental to keeping that certification year after year. If your procedures need to be brought up to a standard, Freer Consulting builds customized flowcharts as part of that work, fitted to how your company actually operates. Contact us to schedule a conversation about where to begin.